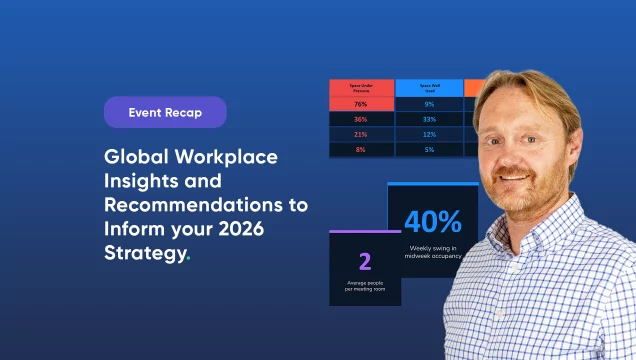
The Freespace Business Intelligence team has delved into the intricacies of 2023 office occupancy data, equipped with these questions:
- What do the occupancy trends in 2023 tell us about people returning to the office globally?
- How have attitudes toward returning to the office evolved throughout the year, and what impact have these changes had on workplace occupancy?
- We know we are witnessing a transformation in our work habits post-pandemic, but are these trends destined to become permanent fixtures?
2023 Office Occupancy Rates Insights
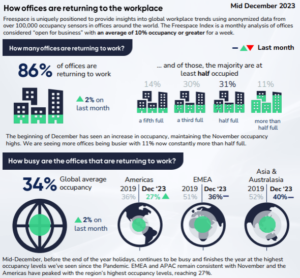
As we reflect on the 2023 Freespace Index, on the surface, it seems to conclude on an optimistic note with every region reaching peak occupancy levels. However, a deeper dive into these statistics presents a different narrative.
The data shows office occupancy rates remained static throughout the year, a stark contrast to the growth trajectory witnessed in 2022. This poses a thought-provoking question – have we, perhaps, stumbled upon a new norm for office occupancy rates?
September 2023 highlighted uncertainties and challenges in the Real Estate industry, as expected seasonal increases didn’t materialize until October and November, emphasising the inconsistency in actual office occupancy compared to anticipated returns.
Reviewing the past three years, global occupancy has been sluggish, with each region facing unique challenges. While 2023 showed growth in comparison to 2022, there was no perceivable growth across the year.
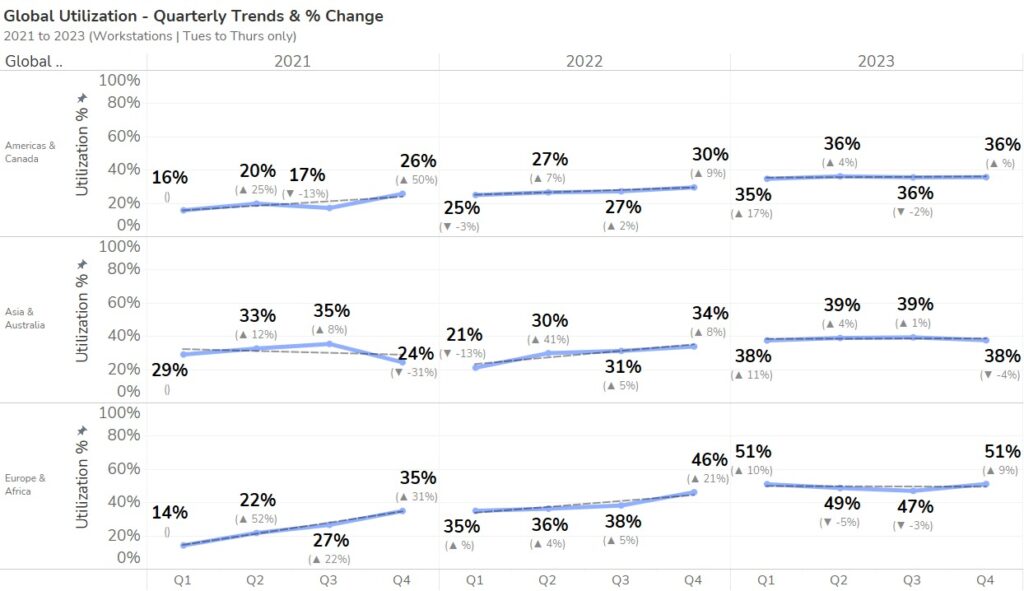
Taking a look at global trends (Figure 2), the lack of a substantial rise in occupancy throughout 2023 contrasts sharply with the noticeable increase observed in 2022 and even 2021.
Observing office attendance requests
Examining people’s intentions to return to the office in 2023, we can pinpoint when their relationship with the office started to change. We track this by observing departmental requests for office attendance, categorizing them as Remote, Hybrid, or Office-based.
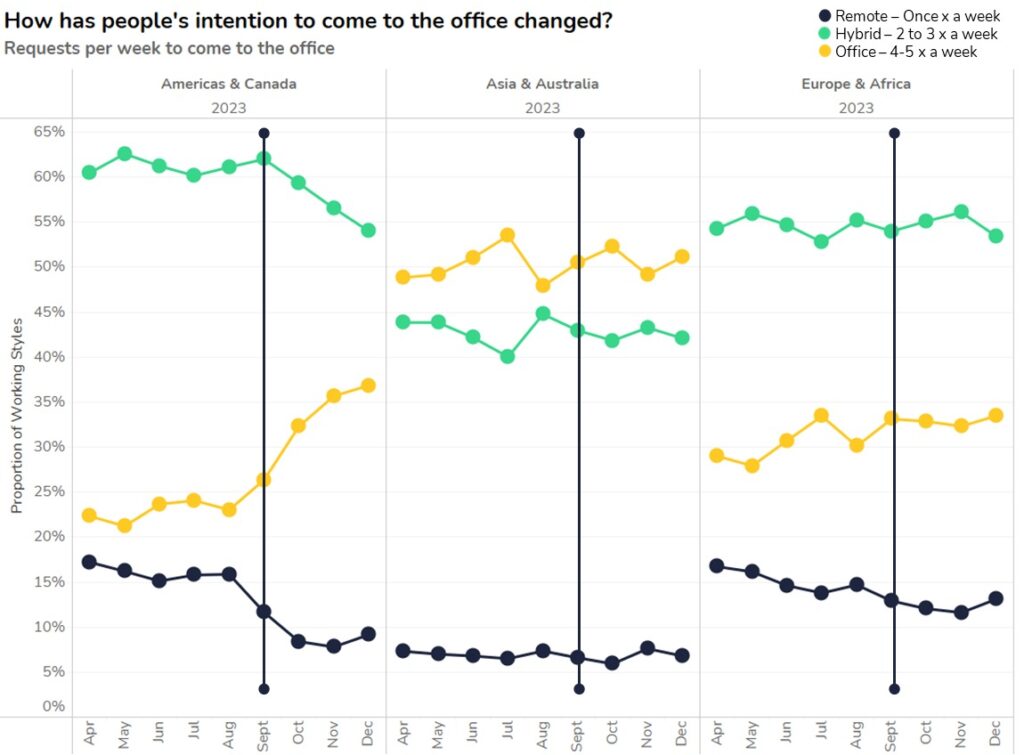
In the initial nine months of 2023, data indicated minimal change in intention to return to office followed by a noticeable uptick after September. This uptick coincided with the enforcement of various office policies.
The Americas, with the most significant disparity, showed a positive response to returning to the office more than three days a week. The year concluded with more people aiming to come in four to five times a week and a decrease in those wanting to come in just once a week.
So, did this intention translate into increased occupancy?
Our analysis reveals that, despite the Americas showing increased enthusiasm for returning to the office, this didn’t actively translate into higher occupancy for Q4. Posing significant challenge. Amid the ongoing pressure for organizations to cut operating costs, it’s crucial to quantify office demand before making strategic decisions—whether to consolidate underutilized spaces or invest in offices that offer ideal workplace experiences, encouraging employees to return.
Regional office usage dynamics in America & Europe
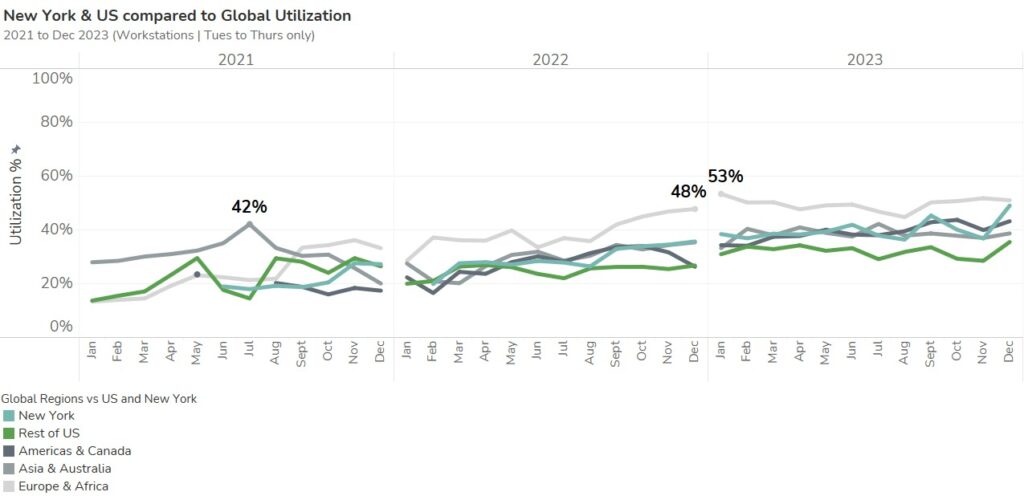
Our analysis of the U.S. and New York shows New York aligning just below global averages (46% – 2023). The rest of the U.S. however, shows distinct path well below the global averages. This divergence became evident around mid-2022 and only grew more conspicuous in 2023, with the rest of the U.S. moving further away from the global norms.
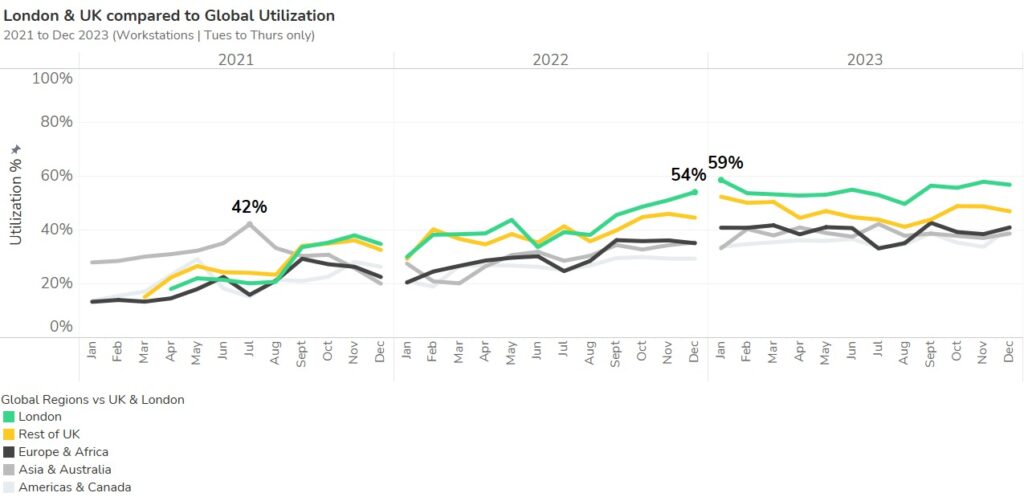
Shifting focus to the UK and the capital, London. In general, the UK has maintained higher occupancy averages in comparison to the global regions. While, at the start of the year, the broader UK lagged just below London, there was a noticeable dip in the middle of the year. Despite this, both are now charting similar trajectories above the global regional averages, with London’s consistently higher occupancy levels throughout 2023 ending at similar levels to the beginning of the year.
Has office usage peaked?
While the overall global occupancy trends are intriguing, a closer look at the city level reveals a diverse and complex picture. This is where the inconsistencies in real estate trends become evident. When comparing daily peak occupancy on the busiest weekdays (Tuesdays to Thursdays) we see a significant disparity between offices thriving and those grappling with challenges.
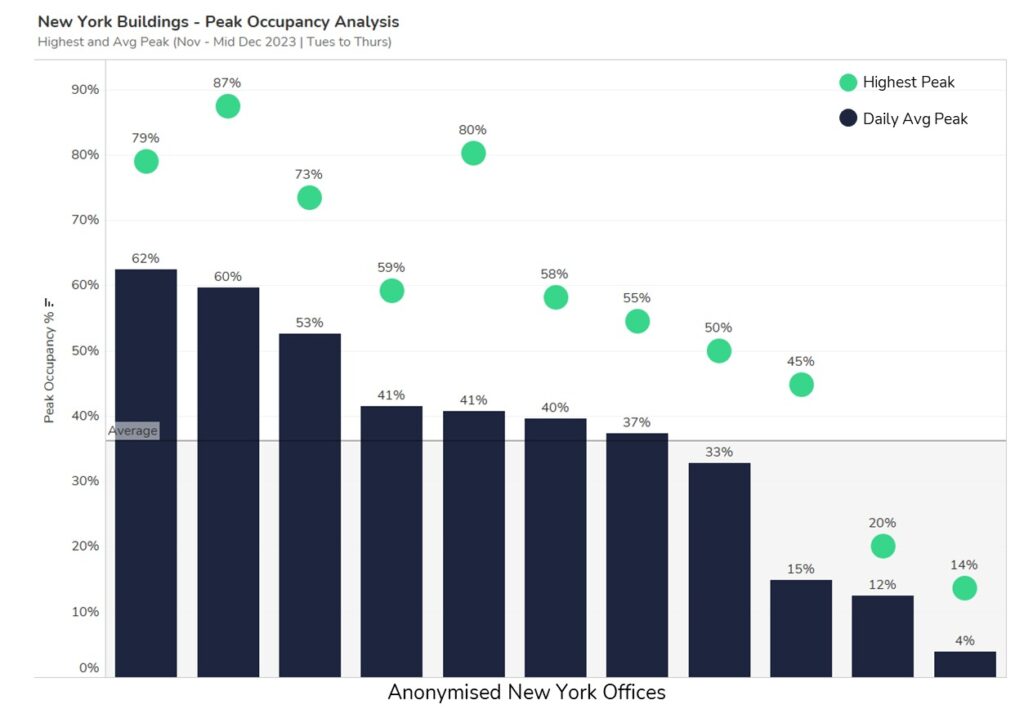
In the case of New York, certain offices bustle on the busiest days, although the majority are yet to reach 50% for an average peak (depicted by the deep blue bars). Days which have witnessed the highest peaks (illustrated by the green dots) soar 20-30% higher than the averages, with a third of the sites reaching beyond 73% occupancy. Intriguingly, the dataset also reveals that a third of buildings have yet to reach beyond 35% occupancy.
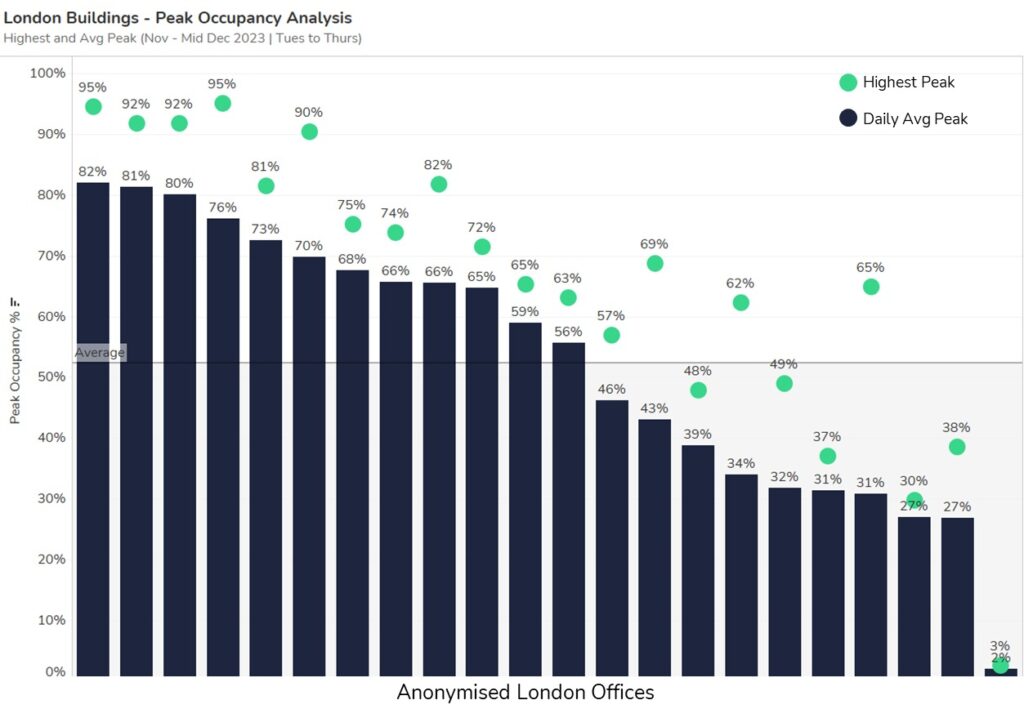
Analysing peak occupancy for London offices shows that while many sites are extremely active – peaking above 50% – over half of the offices have also experienced peak occupancy above the 70% mark, and almost a quarter have achieved an impressive 90% or more desk spaces in use at their highest.
London is a tale of two halves as many offices don’t yet reach 50% at peak. Much like New York, some of these lower occupied offices are seeing spikes of 30% more occupancy on the busiest days.
This varied performance at the city level underscores the complexities and difficulties faced by each Real Estate leader and reinforces the need for data to comprehend the dynamics, guiding solutions like space redesign to address the challenges effectively.
Work schedule variations
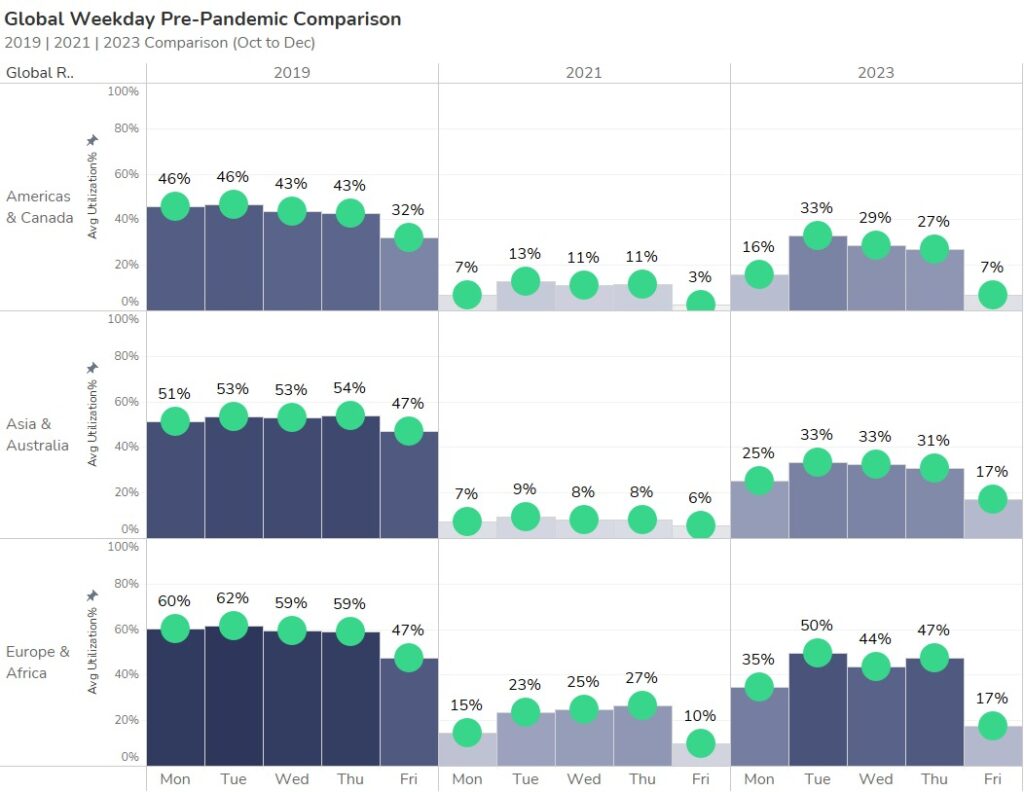
When comparing weekday occupancy from the pre-pandemic era to 2021 and 2023 (Figure 6) reveals an interesting shift. Offices were consistently bustling from Monday to Thursday, with a slight dip on Fridays. In 2023, there’s a noticeable surge in occupancy, particularly mid-week, while Mondays and Fridays maintain their relatively lower levels of activity. Notably, 2023 witnessed an improvement on Mondays, with Fridays consistently lagging, especially in EMEA and the Americas.
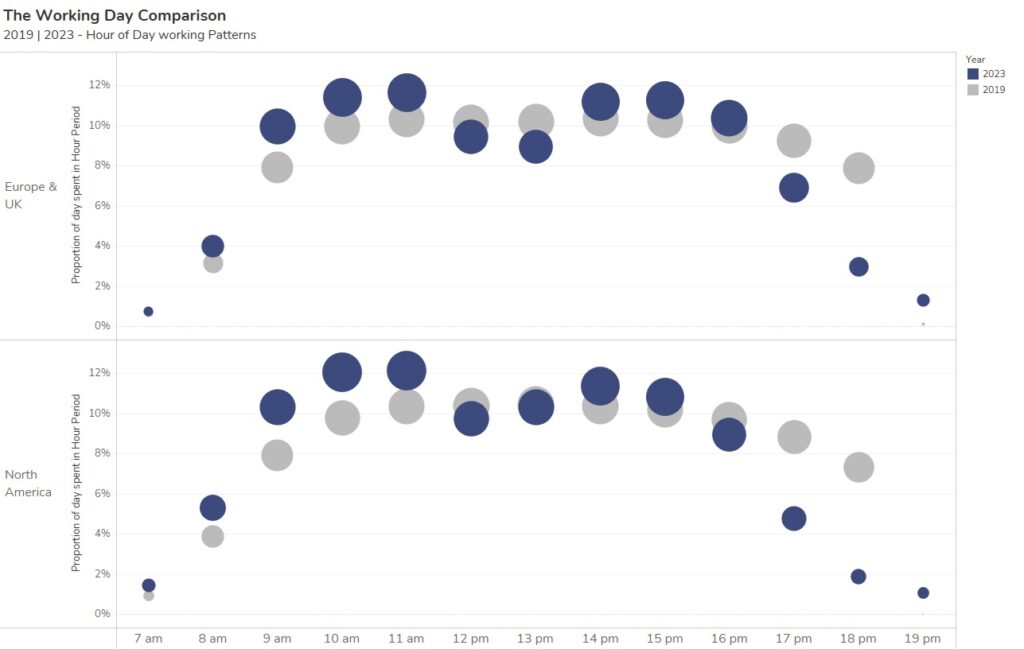
In 2023, our work habits changed compared to 2019. When comparing the proportion of use for each hour of the day against total use, we see a clear distinction in how we work compared to 2019. What is interesting is we are coming earlier, then spending less time at our working spaces over lunch periods and leaving earlier.
This shift shows the evolving approach to organizing our workdays, prioritizing flexibility, and efficiency in the changing workplace. Coming in earlier to avoid peak times, moving away from the workspace for lunch – perhaps socializing with colleagues – and gone are the days of working until late at night as people choose to leave on time.
A look forward into office occupancy rates for 2024 and beyond
In summarizing our analysis of 2023, the Real Estate landscape presents a complex scenario for leaders. Despite increased intentions to come into the office towards the end of the year in response to mandated policies, there was no net increase in occupancy throughout the year. Some offices do exhibit high occupancy, while others are showing minimal growth. As we step into 2024, making informed decisions is paramount in navigating the evolving work landscape. The pressures to reduce operating costs and develop a long-term Real Estate strategy aligning with organizational demands necessitate careful decision-making.
Key actions include:
- Investing in strategic priorities for business success
- Addressing over-pressurized workspaces
- Consolidating underperforming offices
To implement these strategies effectively, organizations must understand the essence of corporate real estate—the people. Successful execution involves establishing a strong connection between employees and the organization, comprehending work dynamics globally, regionally, locally, and individually. Accurate occupancy metrics and analytical insights, facilitated by precise sensor technology, are ideal solutions for achieving this.

Freespace Business Intelligence, driven by Sensors and Real Estate analytics, offers tailored solutions. Through our Right Size and Design Model, we’ve cut real estate costs by up to 21%, repurposing spaces for desks, meeting rooms, and phone booths. Our advanced analytics, powered by non-optical, PII-assured sensors, provide real-time insights and predictive intelligence for occupancy metrics. Our data-driven approach empowers global organizations to optimize spaces, unlocking cost-reduction opportunities.
Navigate the 2024 workplace with transformative insights through Freespace analytics – request a demo.